
As we head into 2026, many investors are asking what history suggests about stock market behavior during a midterm election year. According to research from Strategas, the average S&P 500 intra-year decline in midterm years has been about -19% — noticeably higher than the roughly 13% average in the other years of the cycle.
The two charts shown highlight a few important long-term patterns:
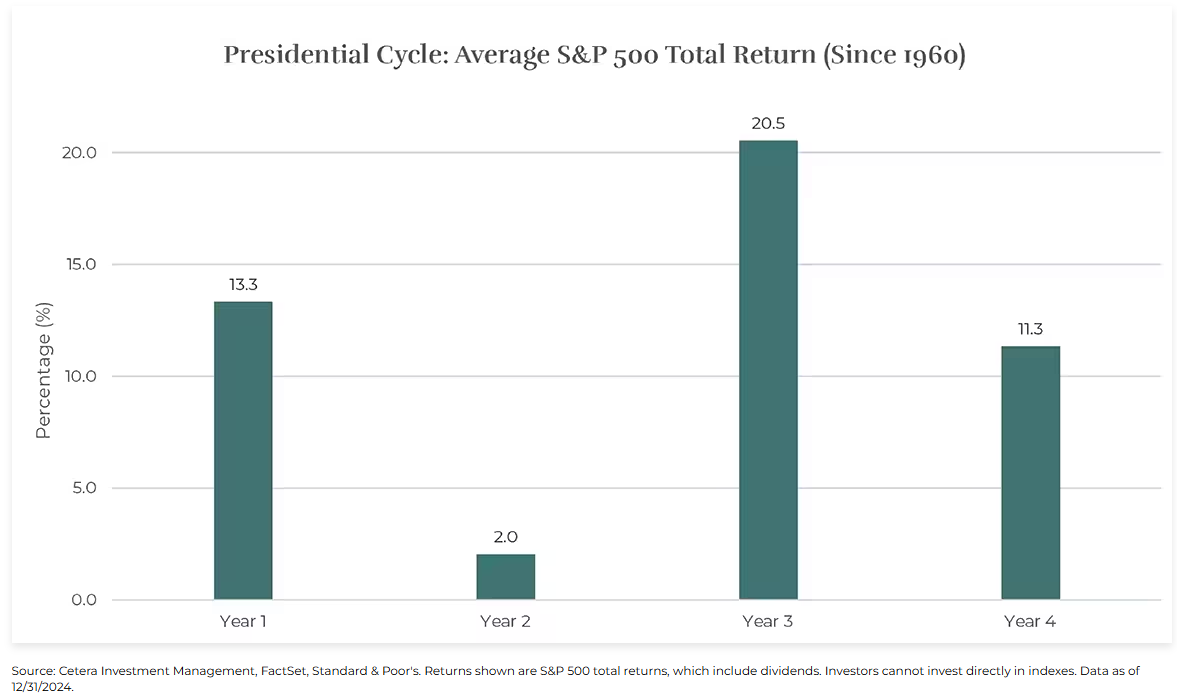
First, when we look at the four-year presidential cycle, midterm years (Year 2) have often been more volatile and, on average, produce lower returns during the year. That short-term uncertainty is normal and has been driven by policy debates, election outcomes, and shifting investor sentiment.

Second—and this is the key takeaway—midterm years have historically included market pullbacks that were followed by strong rebounds. On average, markets that experienced a correction during a midterm year went on to post solid gains over the following 12 months, often leading into a strong third year of the presidential cycle.
What this means for investors:
• Volatility and pullbacks are normal in midterm years
• Corrections have historically created opportunities, not permanent damage
• Staying invested and disciplined has mattered far more than trying to time the headlines
While every year is different and markets don’t move in straight lines, history reinforces an important principle: long-term investors are typically rewarded for patience during periods of uncertainty.
 Click to Talk with an Advisor


